Basalt Hills 2012 Data Set
Table of Contents
1 Introduction
The Intelligent Robotics Group (IRG) conducted an engieering field test with the K-Rex rover during the first week of October 2012. The field test took place at the Basalt Hills quarry, California. A large amount of data useful for research in mapping, localization, and navigation has been collected during this experiment.
1.1 K-Rex Rover
K-Rex is a four wheel drive, four wheel steer vehicle with a wheelbase of ~1.8m and track of ~1.4m, with ATV wheels 26in in diameter. Its overall size is approximately 2.0m x 1.6m and it weighs about 300kg with all its instrumentation. Its mast top is at 1.7 from the ground.
For this field experiment, the rover was equiped with a pair of stereo cameras, a 32 beam laser scanner, two different IMUs, a differential GPS and a compass. The specification of the instruments are listed in Sensor References. Photos front view and back view show K-Rex as it was outfitted for the field test. The short video BasaltHills2012_ExtremeDriving.mov illustrates the K-Rex terrain capabilities.
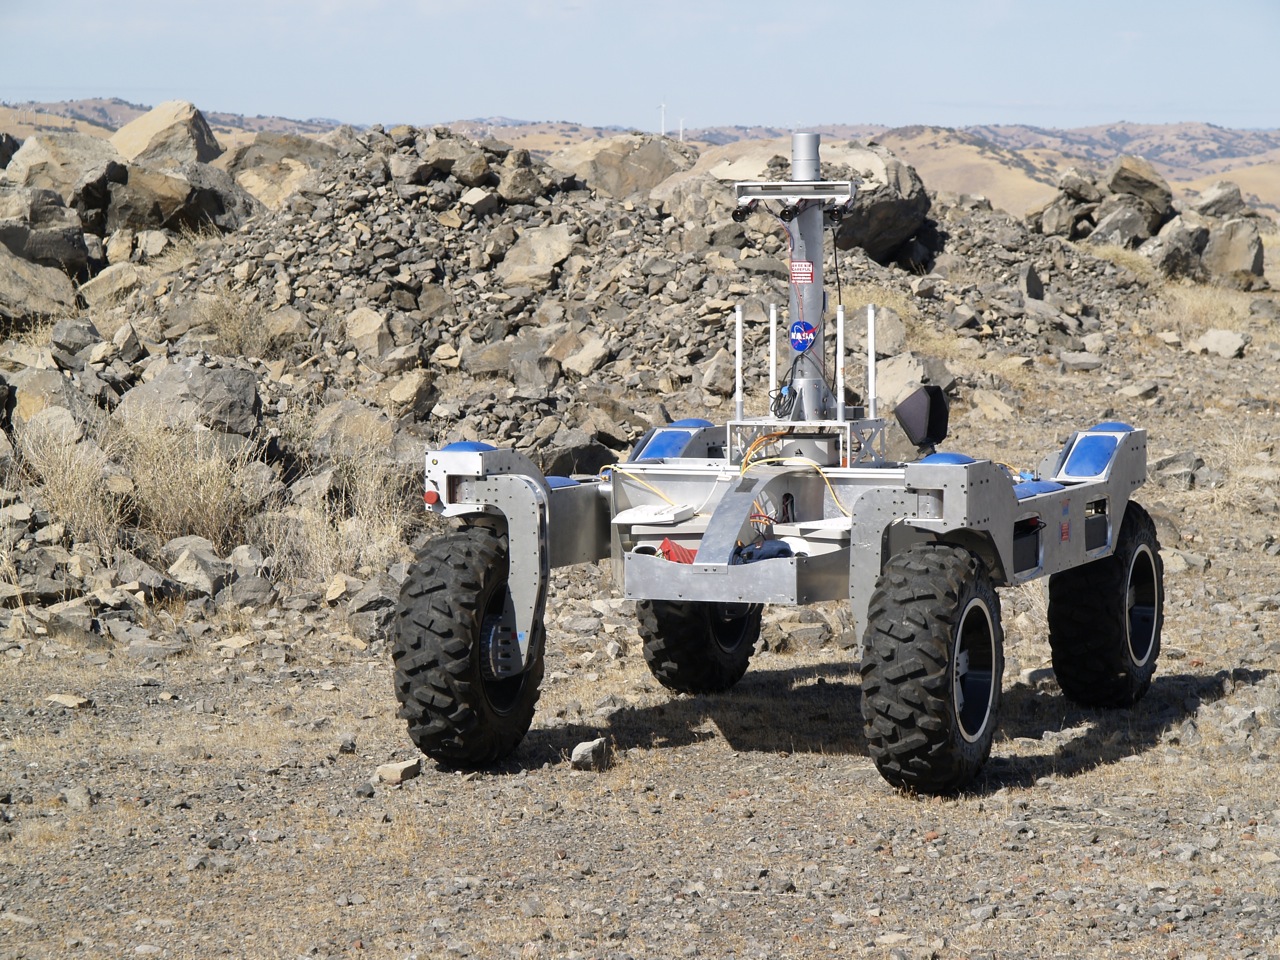
View of K-Rex from the front
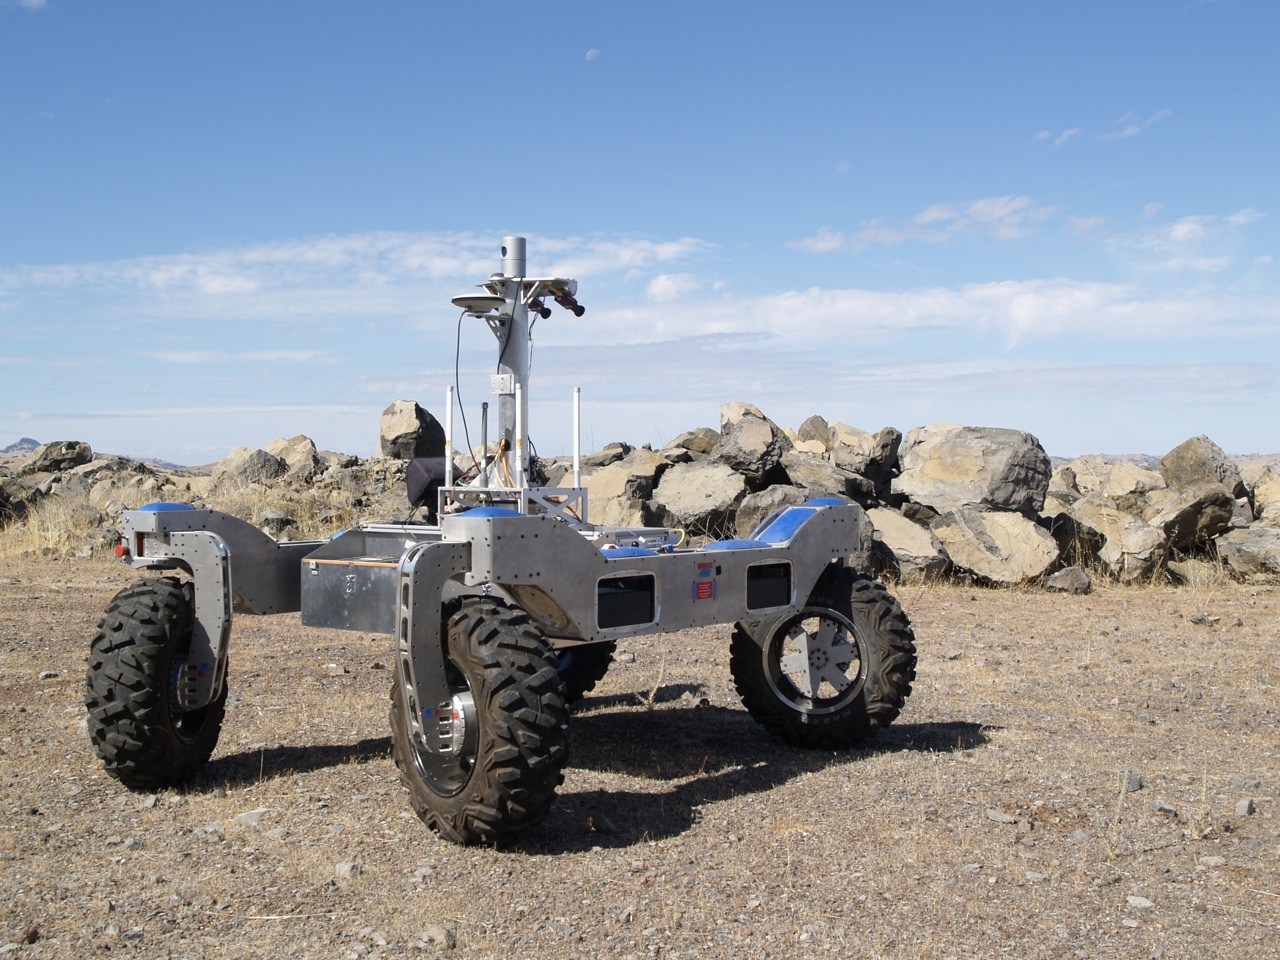
View of K-Rex from the back
1.2 Field Site
The Basalt Hills site is an inactive quarry located next to the San Luis Reservoir, California. It is conviniently located at a 1h40min drive from the Ames Research Center. The Basalt Hills View shows an overview of the quarry.
The bottom of the quarry extends on more than 250m and spreads on multiple layers. Very little vegetation grows in the quarry and the site contains several interesting terrain features (flat, obstacles, cliffs, slopes, corridors, etc.). The rover terrain capability allows to reach different layers of the quarry and descent ~15deg slopes. Typically, the last experiment contains multiple loops on 3 different layers.
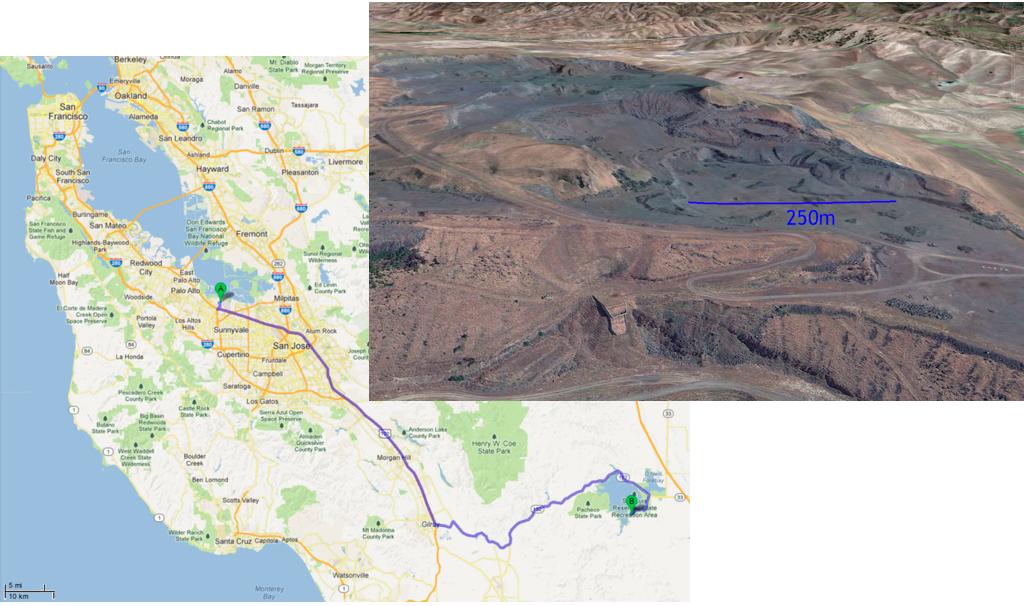
Basalt Hills Site Location
Basalt Hills Site Overview
The MapMakers of IRG produced a high resolution (0.5m/pixel) Digital Elevation Map (DEM) of the site from satellite imagery:
- Large (~3kmx3km) DEM - ./dem/BasaltHills_r1c1_srtm_large-DEM.tif
- Cropped (800mx800m) DEM of the operation area - ./dem/BasaltHills_r1c1_srtm_small-DEM.tif
These DEM products are in GeoTiff format (use
gdalinfo to see the datum) and elevation are coded
with Float32.
To easily view the areas covered by these DEM, hillshade versions of them are also available:
1.3 Experiment
The primary goal of the field experiment was to collect a large data set of stereo images and laser scanner, together with accurate Inertial Measurement System (INS) information to support mapping and navigation work.
For this field test the rover was not driving autonomously, but was controlled using a joystick by a driver with direct view of the rover. This allowed to maximize both the amount of data collected and its quality (by following interesting paths), without being affected by any effect of the autonomous navigation normally used.
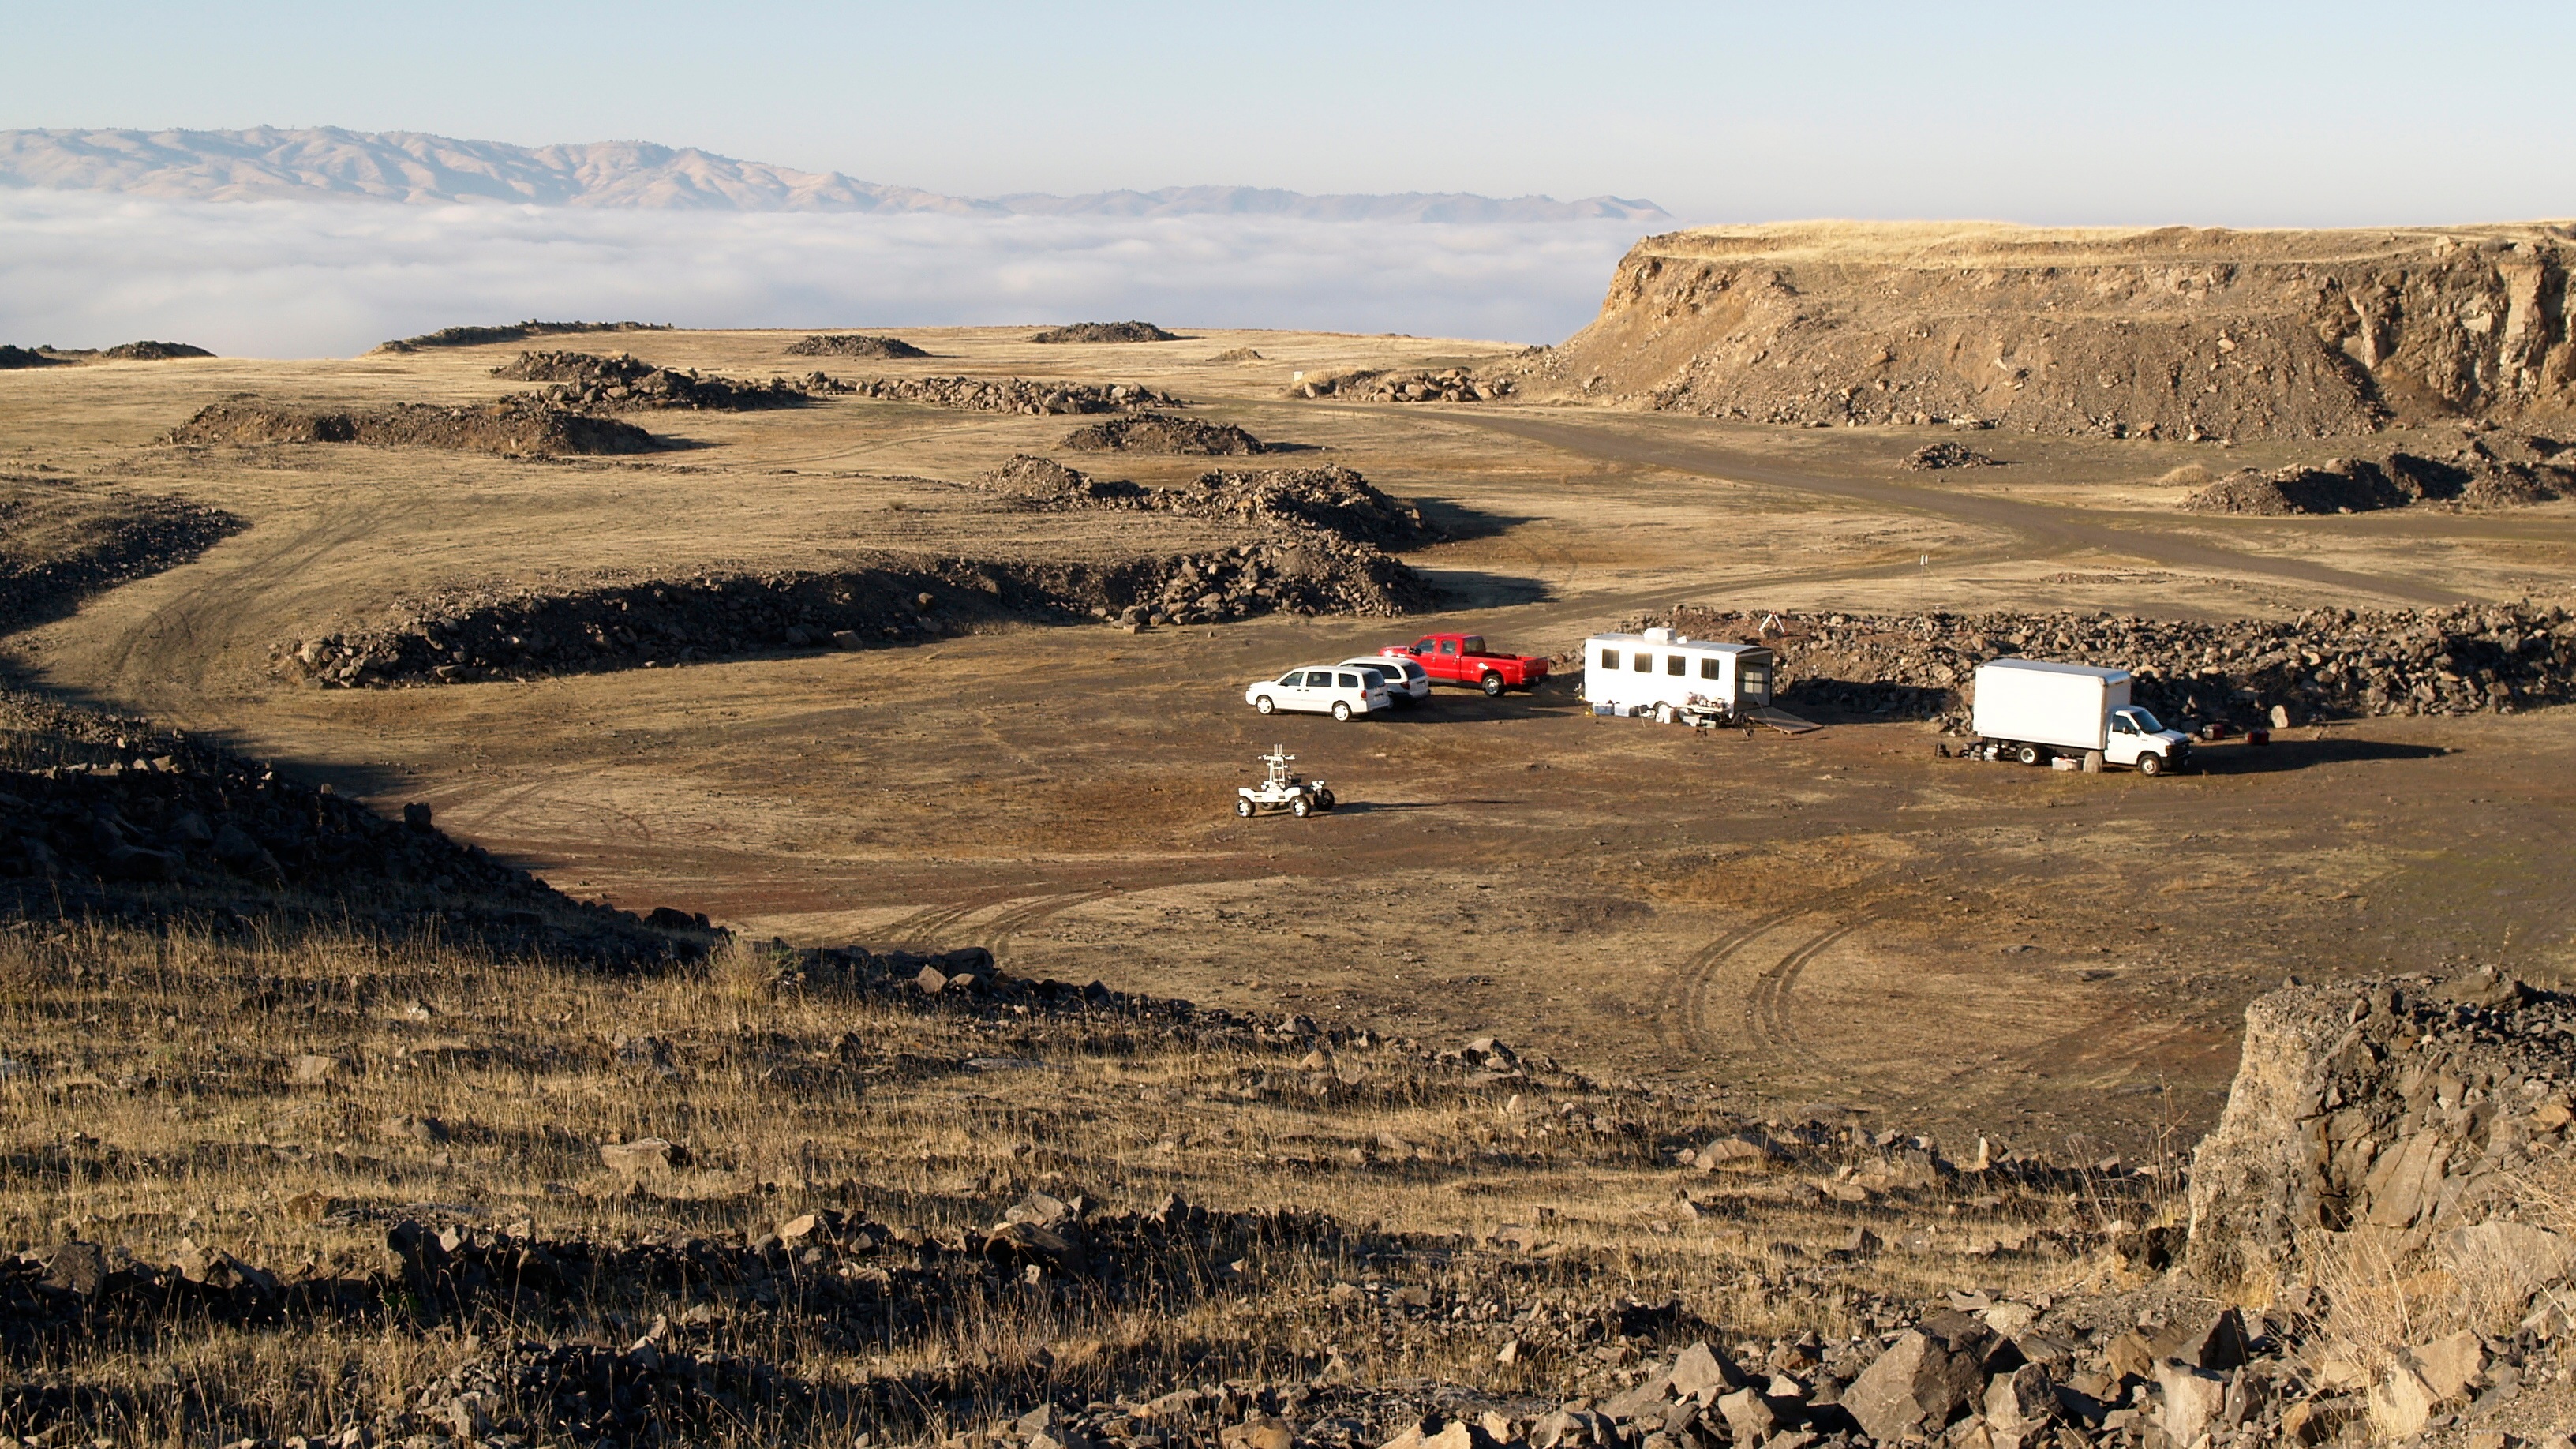
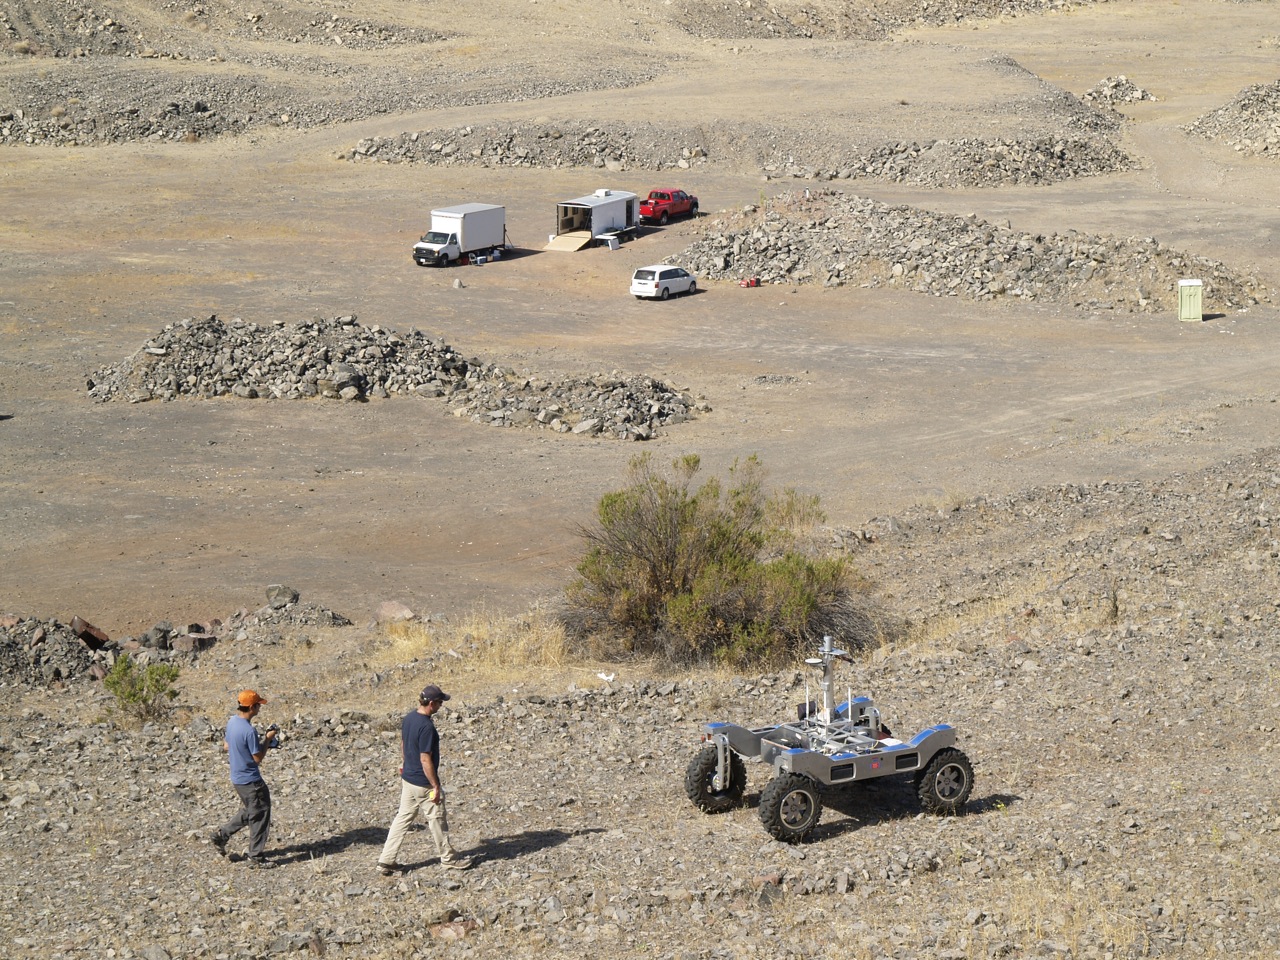
The Basalt Hill Walk photo shows the typical operation mode with one driver and one safety person behind the rover on a path overlooking the bottom of the quary. The video BasaltHills2012_VerveData.mov shows graphically the data collected using the 3D viewwer VERVE.
The result of the experiment is data collected mostly from five rover traverses ranging from 1km to 3km, totalling 11.4km. The Basalt Hills 2012 Tracks screen shot gives an overview of the tracks followed, while the Basal Hills 2012 KML file allows to load the tracks in Google Earth for closer examination. Each KML track is referenced with an icon that contains basic information about the track.
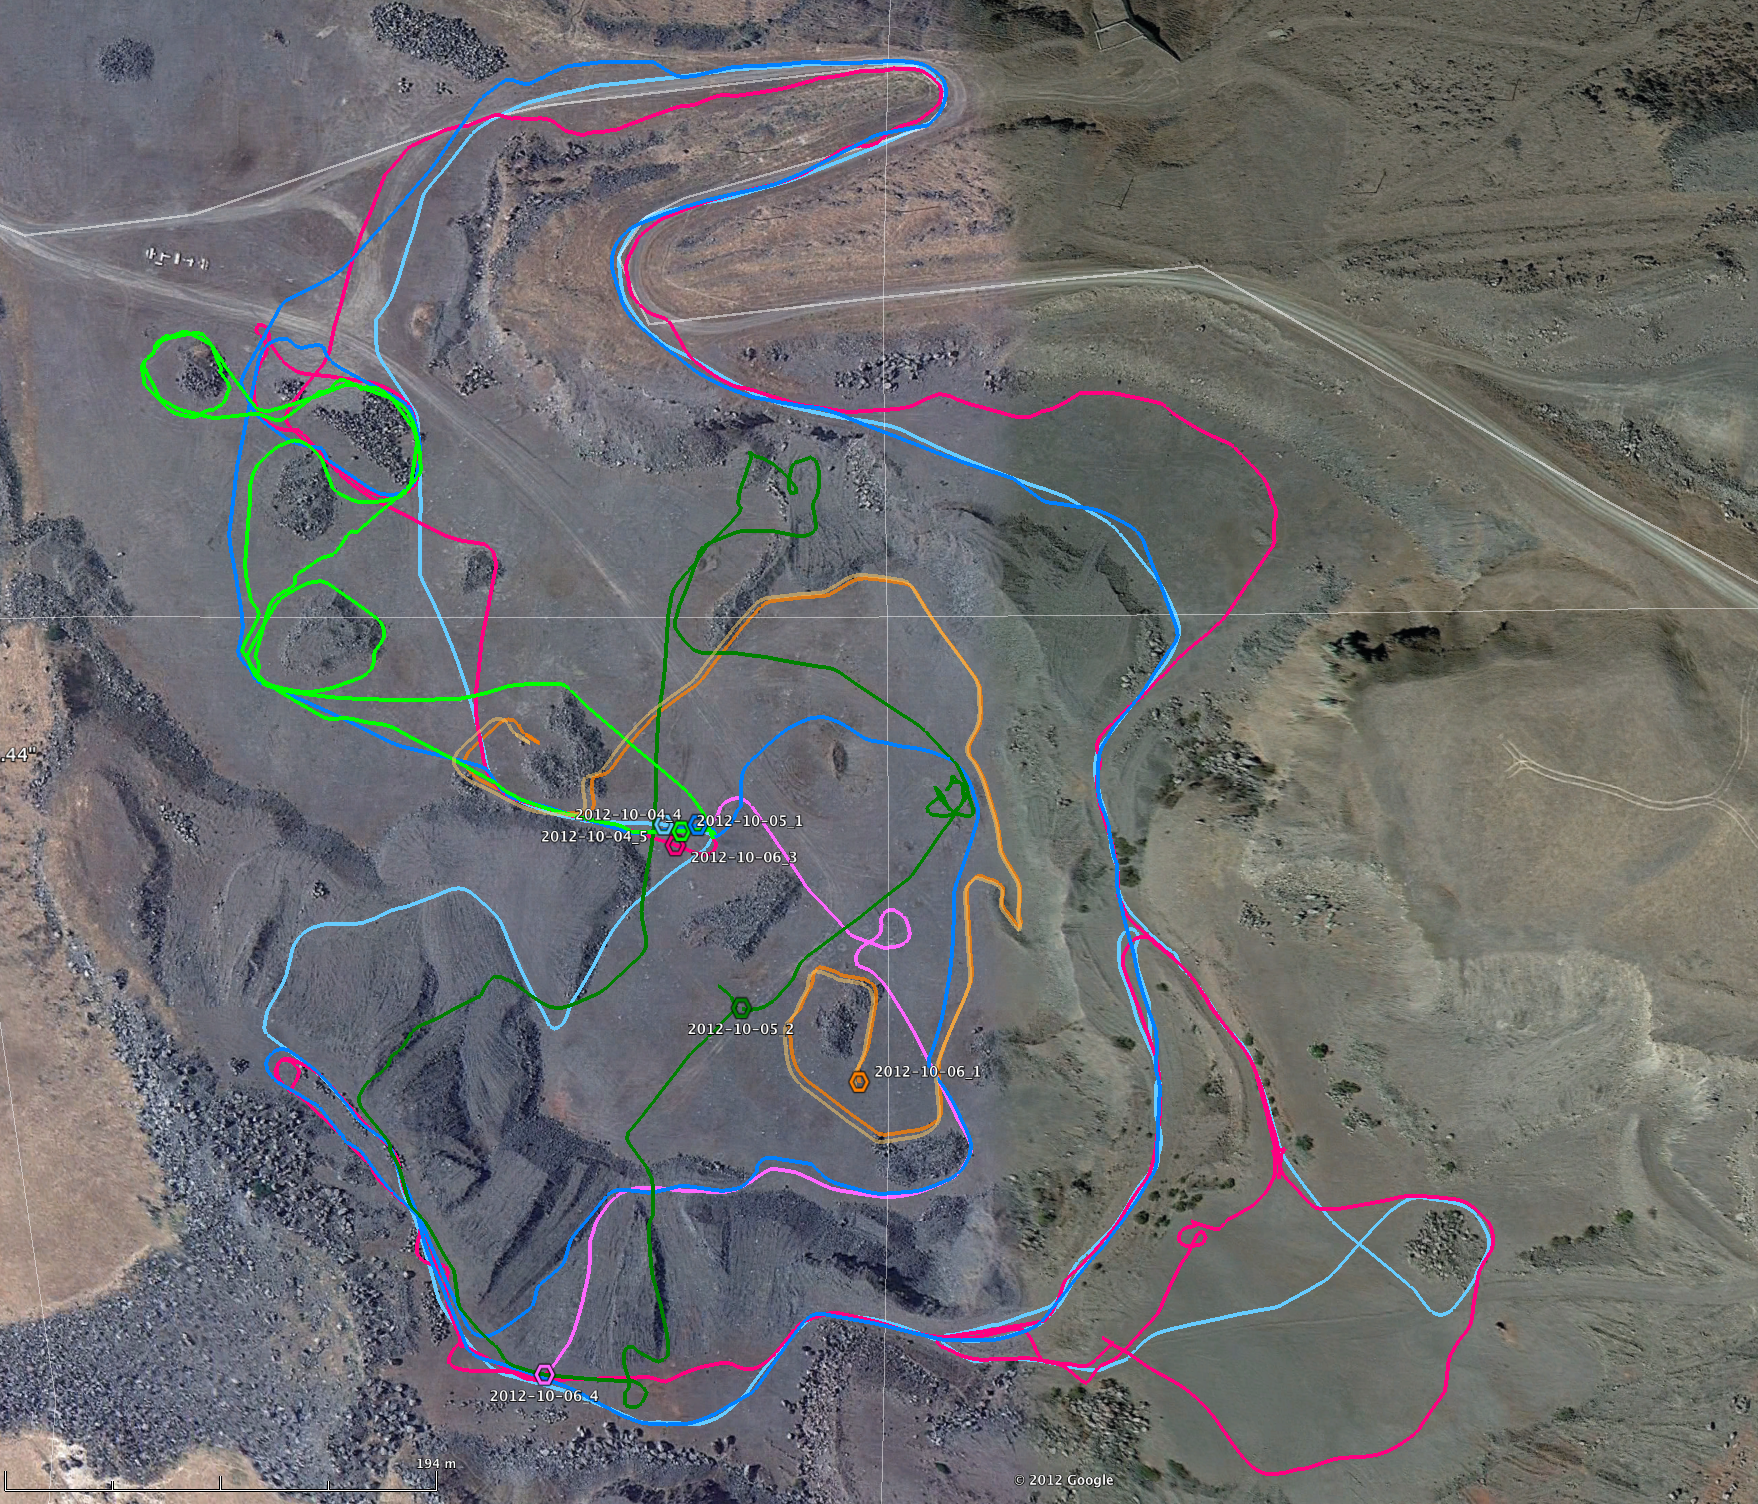
Overview of K-Rex main tracks for the field test
Experiments are referenced by their date plus a number with the
following format: YYYY-MM-DD_N.
1.3.1 Log 2012-10-05_1
Short loop, staying at the bottom of the quarry (single level), with 2 small loops around mounts.
1.3.2 Log 2012-10-06_1
Simple short traverse, without loop, following a quarry cliff and going through a small "valley" at the end. The path choosen exposes a lot of high 3D features.
1.3.3 Log 2012-10-06_3 and log 2012-10-06_4
Single long loop with local loops and running on 3 levels of the
quarry. This is the only traverse that contains data of the
Xsens IMU and HMR3000 compass in addition to the Honeywell IMU.
Unfortunately the data set is split into 2 files. The 2 data
logs 2012-10-06_3 and
2012-10-06_4 need to be combined to form a full
large loop. However each log can also be considered in
isolation. For example on 2012-10-06_4
the rover goes down a slope that can simulate a crater descent.
1.3.4 Log 2012-10-04_5 and log 2012-10-04_5
Medium size loops running on 2 and 3 levels. This data sets do
not include the Xsens IMU and HMR3000 compass and the system may
be less tuned than for the 2012-10-06_[3,4] runs.
However because the data set are smaller and without
interruption, they can still be useful.
1.3.5 Log 2012-10-05_2
Traverse of very rough terrain and climbing steep slopes. This run was performed to test the mobility of the rover and is probably not suitable for mapping or navigation. There may be operators appearing in the field of view of the sensors.
2 Data Set Organization
K-Rex robot controller is build with IRG RoverSW that uses the OMG Data Distribution Service (DDS) standard and RAPID for all telemetry within the rover and to the external world. RAPID is an Open-Source set of NASA standardized messages and utilities for the robotic domain, which uses the DDS transport mechanism. All RAPID messages are captured during the experiment using DDS utilities.
The data is organized as followed under the current directory:
-
rtiDdsLogs: raw log file from the experiment (17GB) -
rapidLogs: converted raw log to the Rapid format for easy replay (~15GB) pgmCameraImages: stereo images (38GB)-
textRoverPositions: CSV and KML rover positions (440MB) configuration: configuration files
2.1 Experiment data
The data captured during the experiment is stored under the
rtiDdsLogs
directory, with one sub-directory per day (which can contain
multiple logs). These log files contains all messages as a binary
SQL database dump and can be "replayed" using the
RTI rtireplay
excecutable. Each sub-directory also contains a
types directory containing the XML DDS (RAPID API)
data type information.
rtireplay is a powerful tool that will generate all
the messages in the exact same way that during the experiment.
However it requires a RTI license. IRG released an Open-Source
version of a similar tool to facilitate the use of the log files
transcoded using Rapid tools (see next section).
For simple usage, position information of the robot has been
extracted and is contained in easily parsable
CSV files. It should be noted that the raw
data files contain all the robot telemetry and a low resolution
JPEG version of the images. The
raw stereo images are available as a
separate set (under pgmCameraImages).
The following data is available in the raw files:
2.1.1 Sensors
| Sensor | DDS Topic Name | Description |
|---|---|---|
| wheel encoders | rapid_joint_sample |
wheel positions |
| differential GPS | rapid_gps_sample |
GPS information from the OEM-3 |
| compass | rapid_float32_sample-hmr |
HMR 3000 compass |
| left camera |
rapid_imagesensor_sample-hazcam_front_left
|
subsampled jpeg left stereo image |
| right camera |
rapid_imagesensor_sample-hazcam_front_right
|
subsampled jped right stereo image |
| INS | rapid_position_sample-ins |
Novatel INS (Honeywell IMU + OEM-3 GPS) |
| laser scanner | rapid_rangescan_sample |
32 beam Veolodyne LIDAR |
2.1.2 Derived data
| Producer | DDS Topic Name | Description |
|---|---|---|
| dead reckoning | rapid_float32_sample-deadReckoning |
dead reckoning position |
| RASM mapper | rapid_geometrymesh_sample |
3D mesh from RASM mapper |
| ARC C2 Mapper | rapid_navmap_sample |
2.5D navigation map |
rapid_navmap_sample-cspace_tiled |
mapping specific pose | |
rapid_navmap_sample-localmap_tiled |
mapping specific pose | |
| stereo | rapid_pointcloud_sample |
Output of stereo |
| position estimator | rapid_position_sample |
Pose estimation from INS + dead reckoning |
| position estimator | rapid_position_sample-relative |
Pose estimation from IMU + dead reckoning |
2.2 Rapid Logs
IRG wrote a log file replay capability built in its own
Open-Source 3D visualization tool
VERVE.
This VERVE plugin can open and replay transcoded raw RTI log files
into the Rapid format. Replaying files with the VERVE-Rapid tool
is completely compatible (from a subscriber point of view) with
the rtireplay system described above.
-
The transcoded log files for VERVE-Rapid replay are in the
rapidLogsdirectory, each experiment package as a zip file - Instructions how to replay these log files with VERVE-Rapid are accessible on the Visualize KRex RAPID log data with VERVE page.
2.3 Stereo images sets
Images captured during the experiment are stored at full
resolution in PGM format under pgmCameraImages. There
is a sub-directory for each file log. Image filenames have the
following pattern:
hazam_front[0,1]-DECIMAL.NUMBER.pgm
- 0 = left image
- 1 = right image
- DECIMAL.NUMBER = time stamp
2.4 Extracted position information
Key position information of K-Rex for each experiment has been
extracted under textRoverPositions. These files
expose basic information to use the data set without setting up a
DDS-RAPID environement for log replay.
2.4.1 Files organization
./textRoverPositions/- Directory with extracted rover positions
krex_poses_2012-10-0?_?.stat-
Information about the corresponding RAPID log file
./rtiDdsLog/2012-1-0#1/RapidLogDatabase-KRex_#2_0 kml_ins/krex_poses_2012-10-0?_?.kml- KML file with the "ground truth" position of the rover
-
kmls_ins+relative_32mZoffset/krex_poses_2012-10-0?_?.kml - KML file with the INS position and the "relative" position (from the pose estimator without GPS), including a 32m positive Z offset for correct visualization in Google Earth (discrepency between terrain and GPS)
2012-10-0?_?/- sub-directory with individual files for each type of position for a particular RAPID log file
-
2012-10-0?_?/rapid_TOPIC_NAME-[TOPIC_SUFFIX]_sample.csv -
CSV file containg the messages
TOPIC_NAME-[TOPIC_SUFFIX]from the RAPID log. krex_poses_2012-10-0?_?.csv- aggregated CSV file with all the topics above in a single file, time ordered.
2.4.2 Field data details
Depending on the position data, it is expressed in one of the following frames:
- UTM
- Position expressed in meters in UTM coordinate system. The Basalt Hills site is in the UTM Zone 10 S.
- Site Frame
-
Reference frame aligned with the UTM grid, with 0,0 set close
the site. Site frame for this data set is:
UTM Zone: 10 S / Northing: 4098907.0 / Easting: 669238.0 Lat/Lon (N/W) 37.0211162212 / -121.0975087332 (Altitude=374m) - Local Frame
- Reference frame aligned with the UTM grid, with 0,0 set when the robot controller starts. Local frame thus changes between experiments and can even be reset is the controller is re-started during an experiment.
The table below summarizes the data fields available in the CSV files:
| File | Ref. Frame | Fields |
|---|---|---|
rapid_float32_sample-deadReckoning.csv |
Local | time, X position, Y position, Heading (radians) |
rapid_float32_sample-hmr.csv |
Local | time, roll, pitch, yaw (radians) |
rapid_gps_sample.csv |
UTM | time, x, y, z |
rapid_joint_sample.csv |
Wheel | wheel odometry in meters (see file header) |
rapid_position_sample.csv |
Site | time, x, y, z, r, p, y |
rapid_position_sample-ins.csv |
UTM | time, x, y, z, r, p, y |
rapid_position_sample-relative.csv |
Local | time, x, y, z, r, p, y |
rapid_position_sample-xsens.csv |
UTM | time, x, y, z, r, p, y |
2.5 Configuration
The robot configuration in term of locomotion geometry, sensor locations and camera calibration is captured in the following files:
3 Sensor References
The names and references to the specicications of the sensors used during the field test are listed below.
3.1 LIDAR: Velodyne HDL-32E
3.2 Cameras: Manta G-146C (3 units) - Baseline = 30cm
3.3 Honeywell IMU (combines with OEM-3 to form turnkey INS): HG1700 from Novatel
- http://www.novatel.com/products/span-gnss-inertial-systems/inertial-measurement-units-imus/
- Uses the IMU-H58 IMU from Honeywell
- HG-1700 Spec. Sheet
3.4 RTK Differential GPS: Novatel OEM-3
3.5 Xsens IMU: MTi-G
3.6 Compass/Inclinometer: HMR3000 (Honeywell)
Date: 2013-12-02 13:13:37 PST
HTML generated by org-mode 7.01h in emacs 23